
- Published on
Activity Diagrams in UM - A Beginner's Guide to Workflow and Process Modeling
Table of Contents
- 🎯 Purpose of Activity Diagrams
- 🧠 When to Use an Activity Diagram?
- 🔧 Key Elements of an Activity Diagram
- ▶️ Start Node
- 🔁 Activity
- 🔀 Decision Node
- ⬆️ Merge Node
- ➕ Fork Node
- 🔀 Join Node
- ⏹️ End Node
- 🛍️ Example: Activity Diagram for Online Shopping
- 🆚 Activity Diagram vs. Sequence Diagram
- 🔍 Real-World Analogy
- 💡 Benefits of Using Activity Diagrams
- 🛠️ Tools to Create Activity Diagrams
- ✅ Summary
An Activity Diagram is a type of UML (Unified Modeling Language) diagram used to model the flow of control or workflow in a system. It represents the steps in a process, the conditions that control those steps, and the overall sequence of operations.
It’s often used to model business processes, use case flows, or logic within a method.
🎯 Purpose of Activity Diagrams
| Goal | Description |
|---|---|
| ✅ Visualize Workflow | Maps out step-by-step execution of a process. |
| ✅ Show Decision Logic | Models if/else paths using branches and guards. |
| ✅ Understand System Behavior | Shows dynamic behavior at a high level. |
| ✅ Simplify Complex Use Cases | Converts a textual use case into a flowchart. |
🧠 When to Use an Activity Diagram?
Use activity diagrams when you want to:
- Model the steps involved in executing a use case.
- Show parallel or conditional workflows.
- Represent business logic or internal operations.
- Visualize automation processes or human workflows.
🔧 Key Elements of an Activity Diagram
▶️ Start Node
- Represents the beginning of the process.
- Symbol: Solid black circle.
🔁 Activity
- Represents a single step or action.
- Symbol: Rounded rectangle (e.g., Add Item to Cart)
🔀 Decision Node
- Branches flow into different paths based on conditions.
- Symbol: Diamond (like in flowcharts)
⬆️ Merge Node
- Combines multiple branches into a single flow.
- Symbol: Diamond
➕ Fork Node
- Splits a flow into parallel activities.
- Symbol: Thick horizontal or vertical line.
🔀 Join Node
- Synchronizes multiple parallel flows into one.
- Symbol: Thick line
⏹️ End Node
- Marks the end of the workflow.
- Symbol: Solid black circle with a surrounding ring
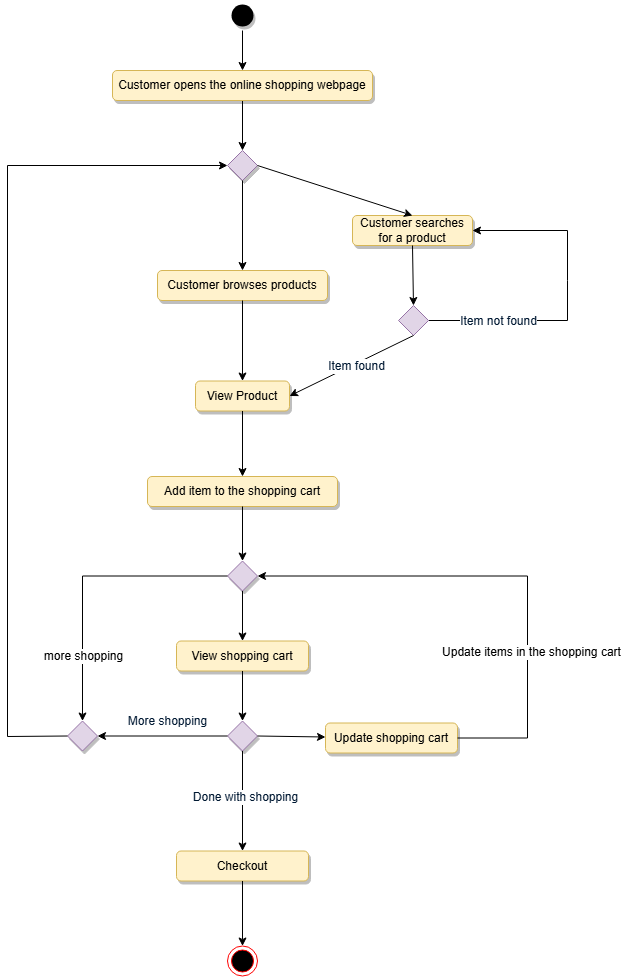
🛍️ Example: Activity Diagram for Online Shopping
Here’s how you might represent a user shopping online:
Start
  ↓
[Browse Products]
  ↓
[Add Item to Cart]
  ↓
[Login/Register]
  ↓
[Proceed to Checkout]
  ↓
     ┌────[Card Payment]────┐
     │                     ↓
[Choose Payment Method] ──> [Apply Coupon?]
                             ↓
                         [Place Order]
                             ↓
                           End
- The diagram shows a clear sequence of user actions.
- Conditional branches (like Apply Coupon?) can be modeled using decision nodes.
🆚 Activity Diagram vs. Sequence Diagram
| Feature | Activity Diagram | Sequence Diagram |
|---|---|---|
| Focus | Process or workflow | Object interactions over time |
| Use Case | Modeling workflows, logic | Modeling communication between objects |
| Looks Like | Flowchart | Time-ordered messages between vertical lines |
| Example Use | Checkout flow, login steps | How UserService interacts with AuthService |
✅ Use Activity Diagrams when focusing on the flow of steps. ✅ Use Sequence Diagrams when focusing on which objects are involved and how they communicate.
🔍 Real-World Analogy
Think of an activity diagram like a step-by-step recipe:
- You start with ingredients (input)
- Perform actions (steps)
- Make decisions (e.g., "if the dough is too wet, add flour")
- End with a result (finished dish)
💡 Benefits of Using Activity Diagrams
| Benefit | Why It’s Useful |
|---|---|
| 📈 Simplifies Complex Logic | Easy to follow even for non-technical stakeholders |
| 🔄 Shows All Possible Paths | Includes alternate, parallel, and conditional flows |
| 🔄 Useful in Automation | Helps model repetitive or rule-based business processes |
| 💬 Improves Communication | Makes discussions between devs and analysts more productive |
🛠️ Tools to Create Activity Diagrams
- Draw.io (Free)
- Lucidchart
- PlantUML
- StarUML
- Visual Paradigm
Just drag and drop shapes to build process flows with start, action, and decision nodes.
✅ Summary
An Activity Diagram is a visual tool in UML used to model the flow of control in a system. Whether you’re illustrating a use case, modeling a business process, or planning a system’s logic, activity diagrams help you visualize the how and when of your system’s operations.
Use them when clarity, flow, and logic matter.
Discussion (0)
No comments yet. Be the first to start the conversation!
Discussion (0)
No comments yet. Be the first to start the conversation!